Electrochemical Noise Measurements Part III: Determination of the noise resistance Rn Corrosion – Application Note 39-3
Latest updated: January 31, 2024Abstract
Noise measurements consist of recording the voltage and current fluctuations occurring when two electrodes of the same material (or not) are shorted. These measurements can lead to the determination of corrosion parameters. The fluctuations are of very small amplitude and this is why the choice of the instrument used in this purpose is critical. Efforts have been made by the American Society for Testing and Materials (ASTM) to give a procedure to characterize the measurement ability of the instrument. This second procedure involves a real electrochemical system namely a steel sample in acidic medium. A comparison of the noise resistance obtained using BioLogic instruments and by the authors lead to conclude that BioLogic instruments are suitable for noise measurements.
Introduction
The objectives of the first and second parts of this note was to show that BioLogic instruments are able to perform reliable noise measurements, compared to ASTM requirements. This third part of this three-note series aims at comparing noise resistance Rn and its polarization resistance Rp for a specific electrochemical system and using this example to describe the EC-Lab® noise analysis tool.
There are several ways to analyze noise data, which are discussed in a review paper written by Cottis [1]. As previously seen, one such way is to calculate a characteristic value of the corroding system called noise resistance Rn.
Rn is defined as the standard deviation of the potential divided by the standard deviation of the current:
$$R_n=\frac{\sigma_E}{\sigma_I} \tag{1}$$
In certain conditions, Rn can be considered equivalent to the polarization resistance Rp. Various authors demonstrated this equivalence [2,3]. In EC-Lab® and EC-Lab® Express, an analysis tool called ENA (Electrochemical Noise Analysis) leads to the determination of Rn. If the impedance of the system is not a simple resistance i.e. if the impedance varies with the frequency, then the standard potential and current deviations need to be calculated using the PSD (Power Spectral Density) [2] and consequently:
$$R_n=\sqrt{\frac{\int_{0}^{\infty}{\Psi_E\left(f\right)df}}{\int_{0}^{\infty}{\Psi_I\left(f\right)df}}} \tag{2}$$
where yE and yI are the Power Spectral Densities (PSDs) of the potential and current noise, expressed in V2/Hz and A2/Hz, respectively and f is the frequency of the noise events. With the ENA tool, the PSDs can be calculated either by DFT (Discrete Fourier Transform) or by MEM (Maximum Entropy Method). This note will describe how to perform and analyze noise measurements using the ENA tool.
Experimental Conditions
For all measurements, the electrolyte was a solution of 0.005 mol·L-1 H2SO4 and 0.495 mol·L-1 Na2SO4 prepared following the ASTM procedure [4]. A BioLogic SP-200 potentiostat with EC-Lab® Express was used along with an Ultra Low Current option.
Impedance Measurement
First of all, an impedance measurement was performed to determine Rp. The Working Electrode (WE) was a 1 cm2 sample of AISI 430 stainless steel, the Counter Electrode (CE) was a graphite electrode and the Reference Electrode (Ref) a Saturated Calomel Electrode (SCE). The AISI sample was polished with 240 and 600-grit SiC paper, following the procedure described in ASTM G5 [5]. The technique used was PEIS and the conditions are listed in Fig. 1. Before performing the impedance measurement, the sample was left in the solution at OCV during 1 hour to make sure it reached a steady-state.
Noise Measurements
Noise measurements were performed using as WE and CE, two 1 cm2 AISI 430 stainless steel samples and as a reference electrode an SCE (Saturated Calomel Electrode). The samples were polished following the procedure described previously. The technique used was ZRA and the conditions are listed in Fig. 2.
The potential range was [-0.255V;-0.206 V] such that the potential measurement resolution is equal to 0.76 µV. The principle of the ZRA technique is to maintain 0 V between two samples: the working electrode (S1) and the counter electrode (S3). The resulting current flowing between the WE and the CE is the ECN (Electrochemical Current Noise). The potential evolution of the couple Ewe/Ece (S1/S3) with respect to the reference electrode (S2) is the EPN (Electrochemical Potential Noise). It is advised to express noise amplitudes without trying to normalize by the area [1].

Figure 1: PEIS conditions.
The sampling time depends on the frequency range of the events of interest. According to the Shannon theorem, if the phenomenon of interest has a frequency f then the sampling frequency must be equal to at least 2f. The conditions used are shown in Fig. 2. Erange of ± 2.5 V for the CE was set.

Figure 2: ZRA conditions.
The measurements were performed in a Faraday cage N-FAR600 provided by BioLogic, earth-grounded to the potentiostat. The upper and lower frequency limits of the noise events are respectively:
fmin = 1/(30·60·30·60·10) ~ 30 nHz and fmax = 1/(2·0.1) = 5 Hz (cf appendix of part I for more details). We also used a 5 Hz analog filter to remove the aliasing of frequencies higher than 5 Hz. This filter is available on SP-200, SP-240, SP-300 and VSP-300.
Results
Impedance Measurement
Figure 3 shows the Nyquist diagram of the impedance measurement described above.
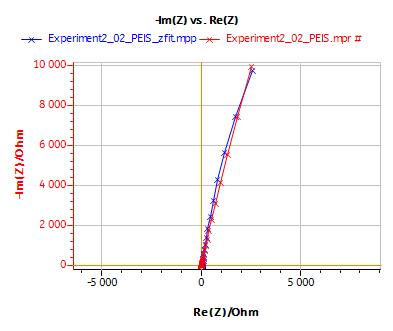
Figure 3: Nyquist diagram of the impedance of an AISI 430 SS steel at Ecorr in a solution of 0.005 mol·L-1 H2SO4 and 0.495 mol·L-1 Na2SO4 [5].
Using the ZFit analysis tool, it can be seen that the electrical circuit equivalent to the impedance of this system is: R1+Q2/R2. The values of parameters obtained by using the minimization algorithm (Randomize+Simplex) are :
R1 = RΩ (electrolyte resistance) = 70 ± 0.3 Ω
R2 = Rp (polarization resistance) = 76,000 ± 500 Ω
C2 (pseudo double layer capacitance obtained with Q2) = 167,000 ± 66 pF [6].

Figure 4: EPN and ECN of AISI 430 in a solution of 0.005 mol·L-1 H2SO4 and 0.495 mol·L-1 Na2SO4
Noise Measurements Using ZRA Technique
In Fig. 4, the evolution of the EPN and the ECN can be seen. The total duration of the noise experiment was 30 min. The data that we chose to analyze were those obtained after 20 min of immersion. The ENA tool is available in the Corrosion submenu of the analysis tools (cf. Fig. 5).
Noise Analysis
Rn Determination
- Description of the methods
A picture of the analysis window is shown in Fig. 6. The analysis tool offers the possibility to remove trends or drifts seen on the EPN or the ECN traces. The trend removal function actually subtracts from the original time trace a numerical curve obtained by either a linear or a 2nd order polynomial fit of the original trace. The traces resulting from trend removal are centered around 0 as can be seen for ECN in Fig. 7.

Figure 5: The Electrochemical Noise Analysis tool
Figure 6 shows the ENA window and the available methods used to calculate Rn. The first method uses Eq. (1) for which the standard deviation is used. According to Eq. (2), Rn can also be calculated using PSDs obtained through the Fourier Transform of the signal. Two methods are available to calculate the Fourier transform: Amplitude spectrum (Discrete Fourier Transform) and MEM (Maximum Entropy Method).
The amplitude spectrum method uses a function to represent a time variable discrete input in the frequency domain. The analysis tool also allows to window the time traces of the ECN and EPN before calculating the amplitude spectrum. Windowing is used to remove the frequency components of the signal created during the calculation of the amplitude spectrum by the discontinuities at the beginning and the end of the time record. More details on the effect of trend removals and windowing will be given in the appendix. Five different windowing processes are proposed in the ENA tool. The expressions for the calculation of the DFT and the windowing are shown in the Fourier transform section of the EC-Lab® and EC-Lab® Express user’s manuals.
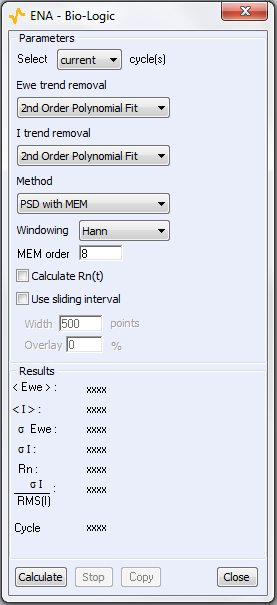
Figure 6: The ENA window
Table I : Rn calculated using the standard deviation with all available trend removal options
| ECN | ||||
| None | Linear | 2nd order | ||
| EPN | None | 432 kΩ | 831 kΩ | 836 kΩ |
| Linear | 24.3 kΩ | 46.7 kΩ | 47 kΩ | |
| 2nd order | 9.5 kΩ | 18.3 kΩ | 18.4 kΩ | |
The MEM is based on the fact that any random time series x(t) can be represented as the output of a filter (here called auto regressive) excited by a white noise (which is a signal with a constant amplitude for all its frequencies). White noise is considered to be the most random signal explaining the name of the method. In the ENA window (Fig. 6), it is possible to choose the MEM order. This order represents the poles of the filter’s transfer function. If the order is equal to n, the number of peaks of the resulting amplitude spectrum is n/2. More details on the MEM applied to the calculation of the Fourier transform of a noise signal can be found in the paper by Bertocci [7].
- Results and comparison with Rp
Table I shows the noise resistance as defined by Eq. (1) with the various available conditions. We can see that trend removal can lead to huge variations.
According to Tab. II, the values of Rn calculated by the amplitude spectrum method are around the same values obtained with the standard deviation for the same trend removal conditions (2nd order polynom on both ECN and EPN).
Figure 7: Detrended ECN resulting from 2nd order polynomial fit trend removal.
Table II: Rn calculated using 2nd order polynomial trend on potential and on current and amplitude spectrum method for the calculation of the PSD, using all available windows.
| Window | Rn /kΩ |
| Rectangle | 18.4 |
| Barlett | 17.9 |
| Hann | 18 |
| Hamming | 18 |
| Blackman | 17.7 |
| Welch | 18 |
Table III shows the values obtained by the ME Method using Barlett window and with an increasing order. With this method, the values obtained are close to the ones obtained by amplitude spectrum for the same trend removal and windowing conditions (2nd order polynom and Barlett windowing). It is interesting to note that Rn seems to reach a minimum after an order number of 6.
Table III: Rn values obtained with MEM for the calculation of the Fourier transform and using increasing orders, with Barlett windowing.
| MEM order | Rn /kΩ |
| 2 | 16,3 |
| 6 | 15,8 |
| 12 | 15,2 |
| 24 | 15 |
Effect of the Trend Removal and Windowing
Fig. 8a compares the amplitude spectrum of the original EPN (Fig. 8a, ■) and the detrended signals obtained by using either a linear (Fig. 8a,▲) or a 2nd order polynomial fit (Fig. 8a, ●). At frequencies lower than 1 Hz, a straight component with a slope of -1 in the logarithmic plot can be seen on the original EPN. This very smooth component is related to the drift as it has also been shown in [8]. In Fig. 9a, it can be seen that the effect of detrending is to remove this smooth component from the amplitude spectrum.
Fig. 9b shows the amplitude spectra of the windowed EPN: original EPN (Fig. 8b, ■), using Hamming window (Fig. 8b,▲) and Barlett window (Fig. 8b, ●). Initially the Hamming window is not as good as the Barlett window to remove the smooth component. Finally, Fig. 8c shows the DFTs of EPN after: no detrending and Barlett windowing (Fig. 8b, ■), linear fit detrending and Barlett windowing (Fig. 8b, ▲), 2nd order polynom fit detrending and Barlett windowing (Fig. 8a, ●). It is clear that 2nd order polynom fit detrending and Barlett windowing provides an amplitude spectrum with the lowest amplitude at the lowest frequencies. More detailed information about the effect of detrending and windowing are given in the appendix.

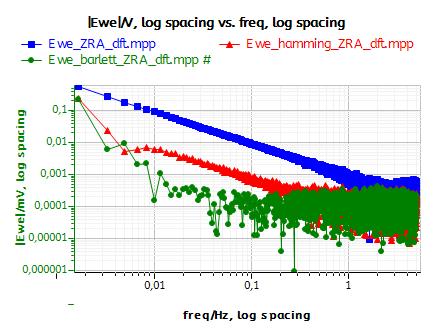
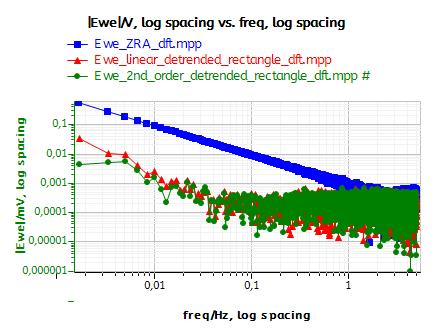
Figure 8: Effect of the windowing and the detrending on the amplitude spectrum of the EPN: a) Detrending only, b) Windowing only, c) Detrending and windowing
Conclusion
The ZRA technique available in EC-Lab® and EC-Lab® Express can be used to perform noise measurements. This technique maintains 0 V between the working and the counter electrode. The associated analysis tools were also described. It was shown in this note that the calculated value Rn is very dependent on the type of data treatment (detrending and windowing). These two processes were shown to have similar effect and to remove the low frequency component. The different methods available in EC-Lab® and EC-Lab® Express must be used to cross-check the Rn value; for instance, in the example above, it seems that the Rn value is around 18 kΩ, because it has been found by all 3 methods (standard deviation, Amplitude spectrum and MEM). This value of Rn is around 3 times lower than the value of Rp determined by impedance spectroscopy.
Data files can be found in :
C:\Users\xxx\Documents\EC-Lab\Data\Samples\Corrosion\AN_39_ZRA_III_XXX
Appendix
The purpose of this appendix is to illustrate the effect of the windowing on the signal. Fig. 10a shows an actual input which was recorded by any device (in our case a potentiostat) between 25 and 75 s. If an amplitude spectrum is performed on this time record, the assumed input signal is shown in Fig. 10b, in which the time record is repeated throughout time.
Discontinuities of the assumed input signal create additional artifact low frequencies to the signal. The main effect of the detrending and the windowing is to remove these artifact frequencies.
By using a linear detrending we remove the linear component of the signal in Fig. 9a. This gives a signal centered around 0, similar to what is shown in Fig. 7. The input assumed by the amplitude spectrum for the same time record as above is shown in Fig. 10a. It can be seen that the discontinuities have disappeared. A window function is a function only defined over the time record that is equal to 0 at its boundaries and equal to one at the center at its definition domain. In Fig. 10b, it can be seen that the assumed input does not contain the discontinuities shown in Fig. 9b.
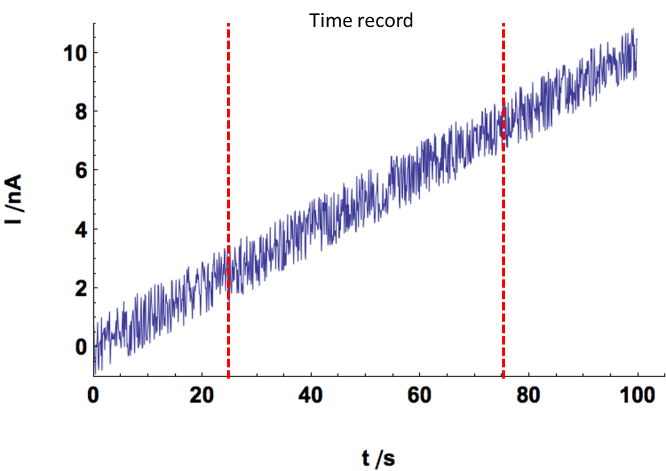
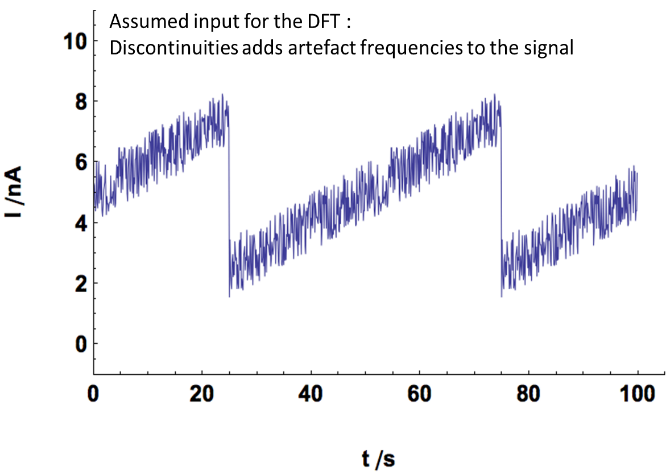
Figure 9: a) Actual input with its time record b) Input assumed by the amplitude spectrum.
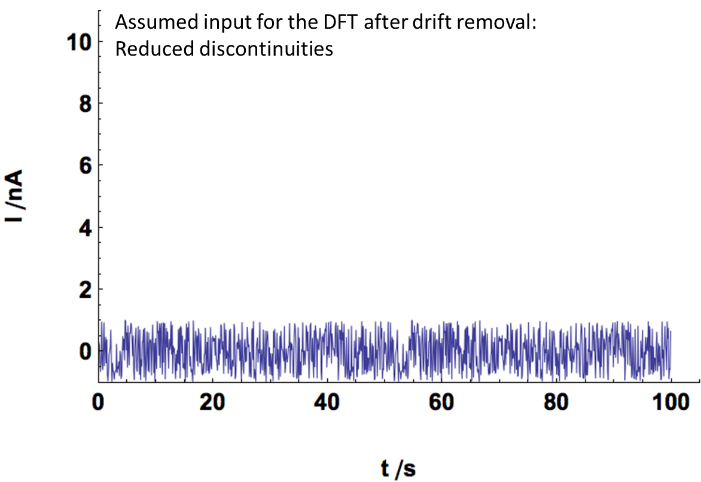

Figure 10: Effect of a) the detrending and b) the windowing on the time record of the actual input signal.
References
1) R. A. Cottis, Corrosion 57, 3 (2001) 265.
2) U. Bertocci, C. Gabrielli, F. Huet, M. Keddam, P. Rousseau, J. Electrochem. Soc. 144 (1997) 37.
3) J. F. Chen, W.F. Bogaerts, Corr. Sci. 37 (1995) 1839.
4) J.R. Kearns, J.R. Scully, “Electrochemical Noise Measurements for Corrosion Applications”, ASTM Intl, West Conshohocken, (1996) 446.
5) ASTM G5-94 Standard Reference Test Method for Making Potentiostatic and Potentiodynamic Anodic Polarization Measurements.
6) Application note #20 “Pseudo capacitance calculation”
7) U. Bertocci, J. Frydman, C. Gabrielli, F. Huet, M. Keddam, J. Electrochem. Soc. 145, 8 (1998) 2780.
8) U. Bertocci, F. Huet, R. P. Nogueira, P. Rousseau, Corrosion NACE 58 4 (2002) 337.
Revised in 08/2019
